Which trading confluence matters most for a reliable entry and why
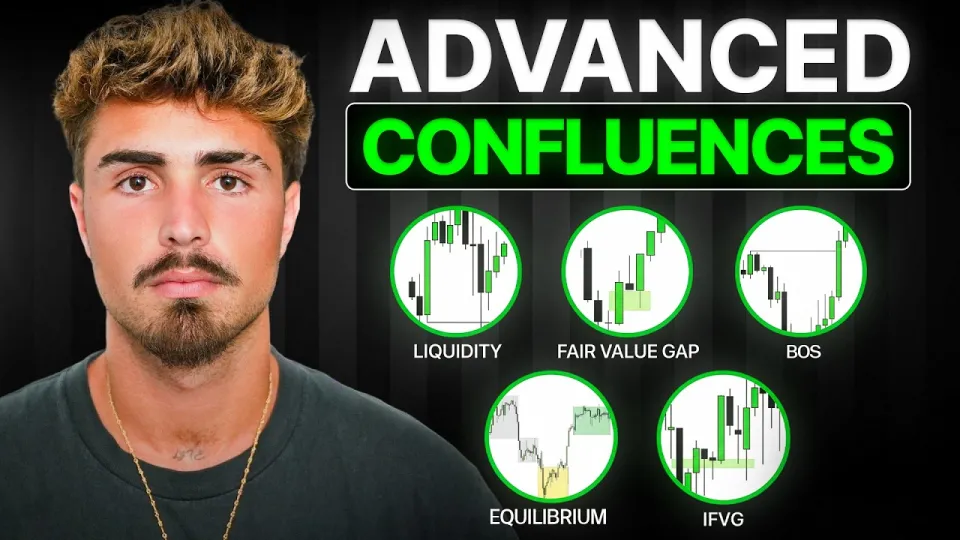
Video: Learn Every Trading Confluence In 18 Minutes
Need articles like this for your video? They help promote it on YouTube and Google — order them in the Telegram bot @sat_sit_bot. The bot writes and publishes the articles itself (with your YouTube video embedded) on popular topical websites (no ads). Try it free: 50 articles on us.
Trading confluence is the practice of stacking independent pieces of evidence — liquidity, fair value gaps, structure breaks — so that a single entry is backed by more than one reason, and the best approach is to rank confluences by what they actually change about probability rather than collecting as many as possible. A confluence earns its place only if it tells you something the previous signal did not. The framework TJR walks through in the video covers the handful of concepts most retail price-action traders keep coming back to, and the free blueprint linked from the channel (get the full-time trader system) is built around the same checklist.
What a trading confluence actually is and what it is not
A confluence is a second, independent reason to take a trade — not a second drawing of the same reason. Liquidity above an old high and a fair value gap sitting just below it are two different pieces of information: one says where resting orders probably sit, the other says where price moved too fast to trade fairly. Two moving averages crossing at the same time as a trendline touch, by contrast, usually restate the same price data and add confidence without adding information.
The practical test is simple: cover the new signal and ask whether your decision changes. If the answer is no, it is decoration. TJR's framing in the video is that these concepts are a vocabulary, and vocabulary only helps when you know which words matter in which sentence.
The five confluences worth learning first
These are the building blocks the video groups together, and each one answers a different question about the chart.
- Liquidity. Where are the obvious stop clusters — above equal highs, below equal lows, at round numbers, at the previous session's high or low? Price is drawn to those pools because that is where fills exist. Liquidity tells you where something is likely to happen.
- Fair value gap (FVG). A three-candle imbalance where the wicks of candle one and candle three do not overlap. It marks an inefficient move that price often revisits. An FVG tells you where the pullback may stop.
- Inverted fair value gap (IFVG). An FVG that price closed through rather than respected. Once a gap fails as support it can act as resistance, and vice versa. The inversion tells you that the side which failed is now the side being defended.
- Equal highs and equal lows. Two or more swings at nearly the same price. They are magnets and, once swept, often mark the start of a real move rather than the end of one. Equal levels tell you where the trap is set.
- Break of structure (BOS). A close beyond the most recent swing high or low that changes the sequence of higher highs and higher lows. BOS tells you which side currently controls the auction.
Used separately, each is a hint. Used in the right order — location first, then structure, then entry — they form a repeatable checklist.
How to rank confluences instead of stacking them
Ranking beats stacking because a chart with eight confirmations usually has one idea repeated eight times. A workable hierarchy looks like this:
- Location decides whether you trade at all. A setup at a swept equal low into a higher-timeframe demand zone is worth watching; the same pattern in the middle of a range is not.
- Structure decides direction. If the last break of structure was bullish, you are looking for longs into discount, not shorts into premium.
- The gap decides the entry. The FVG or IFVG gives you a defined area and therefore a defined invalidation level, which is what makes the risk calculable.
- Everything else is optional. Session timing, volume, a moving average — fine, but they should never rescue a trade that fails the first three tests.
This ordering also solves the most common beginner problem: taking a valid signal in an invalid place. The signal was real; the location was wrong.
Where traders go wrong with confluence trading
Most losses attributed to bad confluences are actually losses from bad process. Three failures repeat.
Confirmation hunting. Waiting for a sixth signal means entering late, after the move has already left the zone. The stop then sits far away and the reward-to-risk collapses. Two ranked confluences plus a defined invalidation is enough.
Hindsight marking. Drawing gaps and structure breaks after the fact makes any chart look clean. Mark levels before the session, screenshot them, and compare with what you actually traded.
Skipping the boring part. A viewer comment on the video makes the point bluntly: you will lose money at the start no matter what, and the traders who last are the ones who keep showing up and keep records. Social media shows the wins, not the hundreds of breakeven mornings. A journal — TJR points viewers to TradeZella, linked below — turns those mornings into data.
Common questions traders ask about confluences
Do I need all five concepts on every trade? No. Most clean setups use two or three. Liquidity plus a fair value gap, or a break of structure plus an inverted gap, covers the majority of decent entries.
Which timeframe should the confluence come from? Structure and liquidity from the higher timeframe, entry from the lower one. A gap on a one-minute chart inside a daily demand zone is a very different trade from the same gap in the middle of nowhere.
What if the gap gets filled and price keeps going? That is information, not a failure. A respected gap suggests continuation; a gap that is closed through and then holds from the other side is the inverted-gap setup, and it usually means the first attempt was the trap.
How many confluences before risking real money? The number matters less than the consistency. Pick two, define the invalidation, size the position so a loss is survivable, and only add a third once the first two have a track record in your own journal.
Useful links
- The exact system for becoming a full-time profitable trader
- Indicators TJR uses daily
- Funded account raffle entry
- Alpha Futures funded accounts, 10% off
- Lucid Trading, 40% off
- Tradeify funded accounts, 30% off
- TradeZella trading journal
- Broker used in the videos
Final thoughts
The useful lesson in TJR's breakdown is not the number of concepts but the order in which they are applied: location, then structure, then entry, then risk. A trader who marks liquidity and structure before the session and waits for a gap to form inside that context will outperform one who collects indicators. TJR's channel is worth following for this style of compact, checklist-driven explanation, and the blueprint is the natural next step if you want the full framework rather than the summary. Trading is risky and most day traders lose money, so treat every confluence as a probability tool, not a guarantee.
Key takeaways
- A confluence is only useful if it changes the probability of the setup, not just the number of lines on the chart.
- Liquidity, fair value gaps, inverted FVGs, equal highs/lows and break of structure are the five building blocks TJR groups under one framework.
- Stacking three unrelated signals from the same chart often means double-counting the same information.
- Entry quality depends on location first: a weaker signal at a swept level beats a strong signal in the middle of a range.
- Risk per trade and a written journal matter more than adding a sixth confirmation.
Source: Learn Every Trading Confluence In 18 Minutes · Markdown version
Questions & answers
How many confluences should a trade have before I enter?
Two or three well-chosen ones are usually enough: a location such as swept liquidity, a directional bias from break of structure, and an entry area from a fair value gap. Adding more often means entering late with a worse stop, which hurts reward-to-risk more than the extra confirmation helps.
Is a fair value gap still valid after it has been tested once?
It can be, but the quality drops with each touch. A gap that is respected once and then used again as an entry is weaker than a fresh one. If price closes fully through it and then holds from the opposite side, treat it as an inverted fair value gap rather than the original setup.
Why do my confluences look perfect in hindsight but fail live?
Because marking levels after the move is easy and marking them before the session is hard. Write your levels down, screenshot the chart before the open, and compare that with your executed trades. The gap between the two versions is usually where the real problem sits, not in the concepts themselves.
Do I need paid indicators or a funded account to trade confluences?
No. Liquidity, structure and gaps can all be marked on a bare chart. Paid tools help with speed and journaling, and funded accounts change the capital maths, but neither fixes a process that lacks a defined invalidation and consistent risk per trade.